Academic writing process and associated tools

The main stages of my academic writing process:

  1. Note-taking (empirical data collection or taking reading notes);
  2. Analysis and evaluation, resulting in
    • an abstracted list of observations;
    • a selection of evidence (quotes and notes);
  3. Organising these findings by: [2 and 3 can be done concurrently]
    • Ordering the list into a hierarchical outline;
    • Attaching selected evidence to list items;
  4. Developing a separate outline for a draft (journal article or thesis or book chapter):
    • creating a hierarchical list of items (titles);
    • attaching a selection of evidence (quotes and notes) to the items as inline notes;
  5. Writing the draft;
  6. Adding a reverse outline (headings and subheadings) to the draft [5 and 6 are a more or less simultaneous, recursive process] .
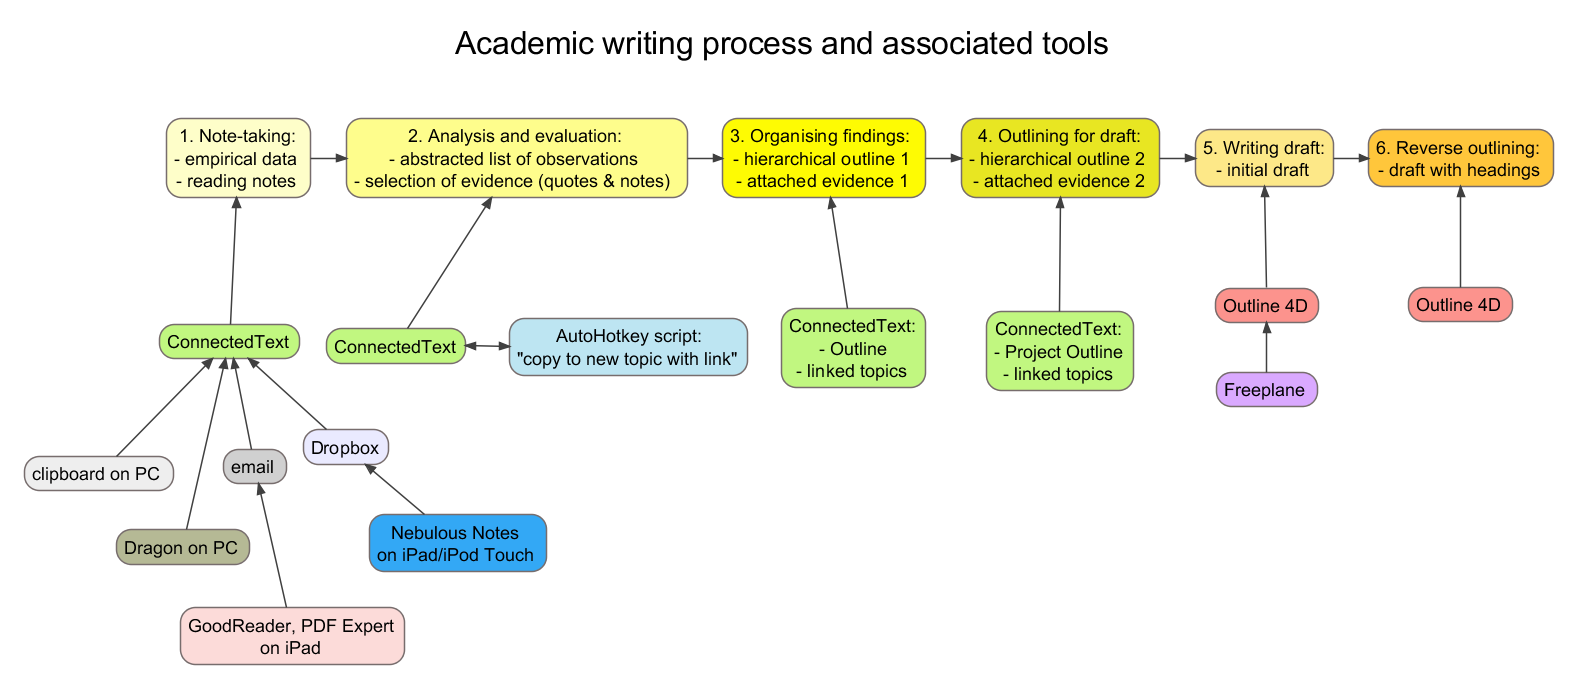
academic writing process

Tools needed:

  1. Note-taking (empirical data collection or taking reading notes);
    1. TOOLS:
      • CT (ConnectedText) – Clipboard Catcher (or clipboard extender)
      • Nebulous Notes on iPad/iPod Touch > Dropbox > CT
      • Dragon NaturallySpeaking (on PC) > CT
      • GoodReader, PDF Expert on iPad > email > CT
  1. Analysis and evaluation, resulting in
    • an abstracted list of observations;
    • a selection of evidence (quotes and notes);
    1. TOOLS:
  1. Organising these findings by: [2 and 3 can be done concurrently]
    • Ordering the list into a hierarchical outline;
    • Attaching selected evidence to outline items;
    1. TOOLS:
      • CT outline (occasionally exported to and imported back from Natara Bonsai)
      • CT outline + linked CT topics
  1. Developing a separate outline for a draft (journal article or thesis or book chapter):
    • creating a hierarchical list of items (titles);
    • attaching a selection of evidence (quotes and notes) to the items as inline notes;
    1. TOOLS:
      • CT Project Outline with links to topics
  1. Writing the draft;
    1. TOOLS:
      • Outline 4D
      • Freeplane
  1. Adding a reverse outline (headings and subheadings) to the draft.
    1. TOOLS:

Update (24/01/2013)

The above chart could have been more representative by having an arrow between ConnectedText in Step 4 and Freeplane in Step 5, as the CT project outline would be exported as a .mm file and imported into Freeplane. This is an important relationship as the links to the selected CT topics will be preserved and remain clickable, thus turning CT+Freeplane into a virtual dual-pane outliner/notes organiser.

Also, Steps 5 and 6 should have been alongside each other or at least there should have been arrows pointing back from 6 to 5, as the reverse outlining process is part of the drafting process. After writing 3 or 4 paragraphs I immediately add headings and sub-headings and slot them into Outline 4D’s single-pane hierarchical outline.

Update 2 (24/01/2013)

Here is an amended chart, taking into consideration the above corrections:

academic writing process 2Update 3 (24/01/2013)

Upon further reflection this is still not an entirely accurate picture of the entire process and set-up. An additional element emerges in Stages 5 and 6: the management of writing fragments that have to be removed from the draft in Outline 4D during interim editing and need to be kept apart. I may reuse some of these later, if and when the need arises.

Initially I just used a text document in NoteTab for this. But as the number of fragments grew, I needed a more sophisticated solution with the ability to split text into paragraphs and rearrange them in a hierarchical outline. For now I’ve been using Scrivener for Windows for this, which works well as a two-pane organiser of notes and also has the handy “split selection with title” command for breaking up a text into segments. However, I find Scrivener a bit of an overkill (and too slow on my Windows 7 system) for this. I’d prefer to use a lightweight, small footprint two-pane outliner that allows for the easy rearrangement of fragments.

Why use ConnectedText for qualitative data analysis?

This is my first post in what hopefully will become a series of posts on how I use ConnectedText (CT) for qualitative data analysis, as part of my Ph.D. project. You may ask: “Why bother using CT, a personal wiki, for qualitative data analysis when there are such long-standing dedicated CAQDAS tools on the market such as Atlas.ti and NVivo?” That is a legitimate question. Some people may indeed find that Atlas.ti or NVivo works better for them. However, based on my personal experience as a PhD student, I found that neither Atlas.ti or NVivo was quite right for me. Finding CT was a revelation, as it allowed me to overcome some problems (more about those later) that I couldn’t solve with NVivo, my CAQDAS of choice prior to CT.

How to select a CAQDAS for your study? Try several if you can. Test them on a pilot project. Take workshops on them. Although here I will be recommending CT as CAQDAS for particular qualitative analysis jobs, I still suggest you use either Atlas.ti or NVivo extensively for a prolonged period of time to learn about how mainstream CAQDAS work.

What was my experience with CAQDAS? I took a couple of workshops in Atlas.ti, got a copy and trialled it repeatedly over the years. As far as I know, Atlas.ti was originally developed to implement grounded theory, and as I wasn’t completely convinced by its implicit research philosophy (which still seemed a bit positivist to me, although otherwise I’m all in favour of grounded theory’s bottom-up approach), I found some of the lingo, the design and the interface off-putting. I discovered that I was a visual learner and found that Atlas.ti wasn’t accommodating my type of learner. I found it difficult to visualise the conceptual linkages between Atlas.ti’s various commands and floating windows.

NVivo 8, on the other hand, immediately appealed to me the first time I laid my eyes on it. I could see how its different tools related to each other. At its heart there was a hierarchical folder structure that worked like many other Windows-based software. It also seemed more neutral from a research philosophy perspective. In the end I spent 6 months analysing my qualitative data in NVivo. I used it to code about half of my data (interviews, participant observations, and a variety of collected documents in a range of media and file formats). I enjoyed doing the coding with it. [The screenshots below are of the example database that comes with NVivo.]

Why did I abandon NVivo? The main reason had to do with the limitations of NVivo’s interface, or rather the way its tools are organised and the way this organisation forces you to follow a particular analytical logic. The underlying issue is the hierarchical organisation of folders and tools, which, ironically, was the reason I chose NVivo over Atlas.ti in the first place. The problem was that different elements of the work get separated into different folders, which can’t be viewed at the same time, thus breaking up the workflow and the analytical reasoning.

After all my coding I ended up with a hierarchical forest of codes (a lot more complex one than the example in the above image) and it was difficult to see how to bring them all together again in order to synthesise them into findings and a coherent answer to my research question. I was stuck and confused, as I also lost my overview of all the data that I had reviewed and stored in there. (In fact, in my desperation I took screenshots of my NVivo codes and pasted them into PowerPoint, and continued the rest of the work outside of NVivo. It helped to cut a Gordian knot but I still ended up needing another CAQDAS solution for the rest of my data).

I also realised that NVivo is a wiki forced into a hierarchical straight-jacket. You are essentially creating links between different documents and then these links are presented to you in a hierarchical organisation. This rekindled my interest in personal wikis again. Since the early days of my PhD I wished that there was a way to create a dashboard for my dissertation project, from which all my files (both data and my analysis and writings) would be linked in the manner of an intranet. I have experimented with Planz, WhizFolders and a range of desktop wikis but none of them were quite right. In fact I also checked out ConnectedText a few times over the years but I never managed to make sense of it. However, my problems with NVivo’s hierarchical structure convinced me to have another go with the wiki format. Fortuitously, there were a series of helpful posts on Outliner Software and on his blog by Steve Zeoli, which finally led me to an epiphany with CT. But more about that in my next post.

There were some other reasons too why I was happy to say good-bye to NVivo (and the same is true for Atlas.ti). One was the enormous price tag and their licensing regime. Although I got a very cheap, subsidised license from my university, it needs to be renewed annually, and after I graduate I may need to shell out some serious money if I want to have continued access to the data in the form it’s organised in NVivo. To me it seems that NVivo and Atlas.ti to some extent cornered the market and are taking advantage of the fact that PhD students are a captive audience, strongly influenced by the preferences of their supervisors, peers and academic tribes. This business attitude I find very unappealing.

Finally, there are the resource requirements of running a software like NVivo. When I installed my first NVivo copy onto my previous computer, a laptop, I wasn’t even able to launch it. It just simply wouldn’t budge and froze my entire machine. I was forced to buy a top-of-the-range PC in order to be able to run it, and even on the new machine it was sluggish. Waiting for files and windows to open for several seconds eventually adds up. Also, as far as I know, all the work in NVivo is saved into a single proprietary file. It is just asking for a lot of faith to put several years worth of data and effort into a single massive file and hope that it will work for 100% of the time forever, that it will never get corrupted etc., etc. I’m not a techie but it seems to me there are some risks associated with that approach.

Still, I’m glad that I had a proper go with NVivo. It was only by spending many months toiling with it that I had learned how CAQDAS work and what the features are that I like and the ones that I would like to have. I was only able to adopt CT as my new CAQDAS tool because I was able to model the processes that I learnt about – or wasn’t allowed to do – in NVivo.

In my next two posts I will introduce the key qualitative data analysis features of CT and I will also provide some tips on how to get started with it, especially if you had never worked with a wiki before.